By Steve Cavolick
When your organization performs well, do you know what factors contributed to success? And when goals fall below expectations, can you pinpoint the exact reasons you underperformed? Whether you work in a traditional company or for a professional football team, the ability to understand the drivers for success can lead to sustained dominance or failure. For example, we can see how football teams are using organized data and advanced analytics to self-evaluate and create an edge against their opponents.
Although quarterback is the most important position in all of professional sports, his supporting cast plays an important role in his and the team’s success. After all, receivers can run the wrong route, players fumble, and blocks can be missed, leading to pressure and broken plays. All of those things contribute directly or indirectly to the success of the quarterback.
However, the strongest impact on QB play comes not from an individual player, but from the performance of the offensive line. This was very noticeable in this year’s Big Game. Using in-game statistical and player movement data, we can discover and explain why each team performed the way it did.
Kansas City had injuries to their two best offensive line players and created a patchwork line that included playing two players out of their natural positions. We know that Patrick Mahomes had little time to throw and seemed like he was never comfortable in the pocket. Using player movement data, R, and the ggplot2 visualization package, data scientist Michael Lopez created an illustration of quarterback movement on passing attempts out of the shotgun formation.
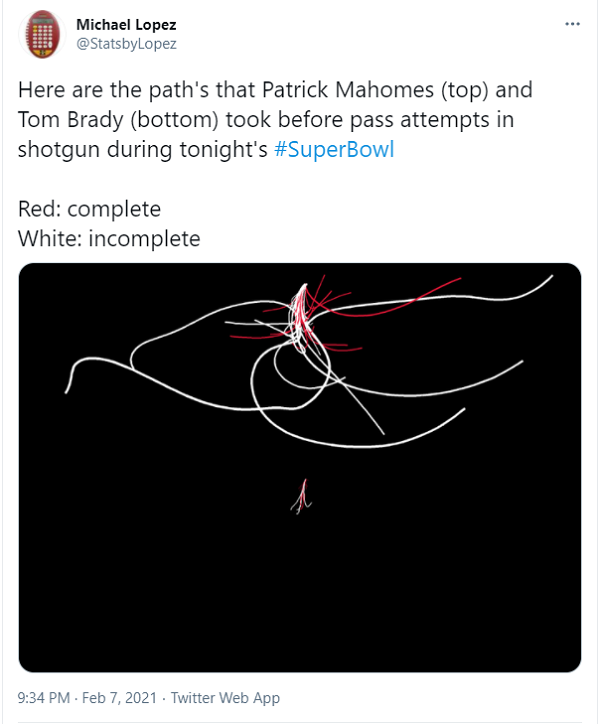
The top figure shows the distance traveled by Mahomes before throwing his passes. If you thought he was running for his life in that game, he was. In fact, the distance covered by the lines represents over 450 yards of running before passing. The bottom figure that looks like a bird’s foot represents the distance Tampa quarterback Tom Brady traveled before throwing his passes. This is important because when a quarterback has time and can stay in the pocket, he can run through his progressions and more easily find an open receiver. Brady was comfortable and didn’t have to move much, and his production of three touchdown passes and zero interceptions reflect that.
We’ve talked about the importance winning “in the trenches” and how it affected Patrick Mahomes, but do the numbers tell us anything about how Tampa’s defense performed?
Next Gen Stats showed us that the Buccaneers pressured the passer with only four rushers on 90% of passing plays. Those four rushers registered a Quarterback Pressure 34% of the time. During the 2020 regular season, Mahomes was under pressure in just 22% of his passing attempts, according to Pro Football Reference. KC could have added another lineman or kept a tight end in to help block, but they didn’t. Instead, they relied on the makeshift five-man line on 92% of passing plays. That was a mistake.
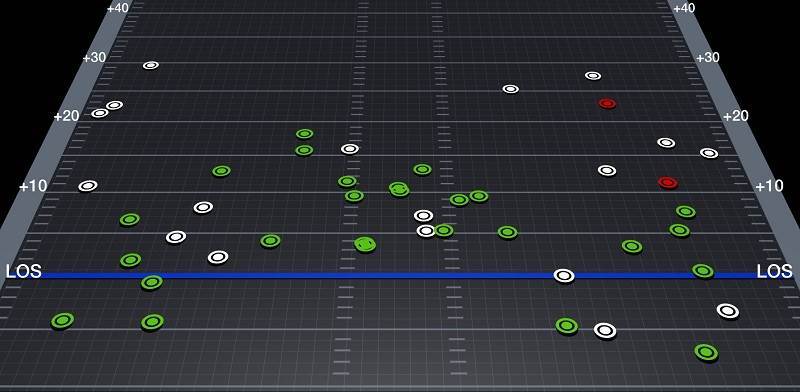
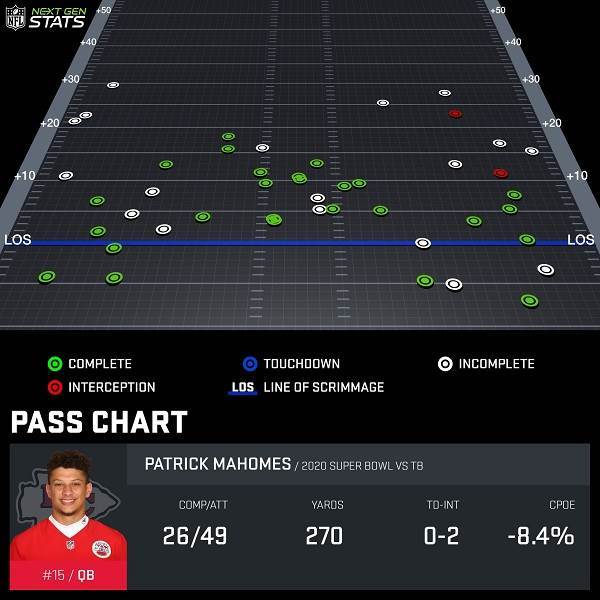
By getting pressure with only four players, Tampa was able to align more defenders to overwhelm the zones where Mahomes typically has success. On deep passes, Mahomes was 0-5 with an interception, and the graphic below from Next Gen Stats shows he was just 10-22 for 50 yards and two interceptions when throwing towards the sidelines. In a previous matchup with Tampa Bay, Mahomes threw for over 300 yards and three TDs to the sidelines. Tampa Bay used data and analytics to understand what Mahomes does well and designed a plan to stop him.
No matter where you are on your journey to AI, the ability to collect, organize, and analyze your data lets you to determine the biggest drivers for success and make adjustments on-the-fly when conditions change.
Are you prepared to throw a long touchdown pass or deploy resources to dominate your market? If you’re not quite there yet, the LRS Big Data and Analytics team has over 20 years of experience implementing applications in advanced analytics, information management, and data warehousing.
Not sure how to get started? Our strategic offerings can help you align business and technology teams, discover the right use case, and determine an ROI. If you are interested in understanding how we can help you find value in your data, please fill out the form below to request a meeting.
About the author
Steve Cavolick is a Senior Solution Architect with LRS IT Solutions. With over 20 years of experience in enterprise business analytics and information management, Steve is 100% focused on helping customers find value in their data to drive better business outcomes. Using technologies from best-of-breed vendors, he has created solutions for the retail, telco, manufacturing, distribution, financial services, gaming, and insurance industries.